Categories
Posts in this category
- Current State of Exceptions in Rakudo and Perl 6
- Meet DBIish, a Perl 6 Database Interface
- doc.perl6.org and p6doc
- Exceptions Grant Report for May 2012
- Exceptions Grant Report -- Final update
- Perl 6 Hackathon in Oslo: Be Prepared!
- Localization for Exception Messages
- News in the Rakudo 2012.05 release
- News in the Rakudo 2012.06 release
- Perl 6 Hackathon in Oslo: Report From The First Day
- Perl 6 Hackathon in Oslo: Report From The Second Day
- Quo Vadis Perl?
- Rakudo Hack: Dynamic Export Lists
- SQLite support for DBIish
- Stop The Rewrites!
- Upcoming Perl 6 Hackathon in Oslo, Norway
- A small regex optimization for NQP and Rakudo
- Pattern Matching and Unpacking
- Rakudo's Abstract Syntax Tree
- The REPL trick
- First day at YAPC::Europe 2013 in Kiev
- YAPC Europe 2013 Day 2
- YAPC Europe 2013 Day 3
- A new Perl 6 community server - call for funding
- New Perl 6 community server now live, accepting signups
- A new Perl 6 community server - update
- All Perl 6 modules in a box
- doc.perl6.org: some stats, future directions
- Profiling Perl 6 code on IRC
- Why is it hard to write a compiler for Perl 6?
- Writing docs helps you take the user's perspective
- Perl 6 Advent Calendar 2016 -- Call for Authors
- Perl 6 By Example: Running Rakudo
- Perl 6 By Example: Formatting a Sudoku Puzzle
- Perl 6 By Example: Testing the Say Function
- Perl 6 By Example: Testing the Timestamp Converter
- Perl 6 By Example: Datetime Conversion for the Command Line
- What is Perl 6?
- Perl 6 By Example, Another Perl 6 Book
- Perl 6 By Example: Silent Cron, a Cron Wrapper
- Perl 6 By Example: Testing Silent Cron
- Perl 6 By Example: Stateful Silent Cron
- Perl 6 By Example: Perl 6 Review
- Perl 6 By Example: Parsing INI files
- Perl 6 By Example: Improved INI Parsing with Grammars
- Perl 6 By Example: Generating Good Parse Errors from a Parser
- Perl 6 By Example: A File and Directory Usage Graph
- Perl 6 By Example: Functional Refactorings for Directory Visualization Code
- Perl 6 By Example: A Unicode Search Tool
- What's a Variable, Exactly?
- Perl 6 By Example: Plotting using Matplotlib and Inline::Python
- Perl 6 By Example: Stacked Plots with Matplotlib
- Perl 6 By Example: Idiomatic Use of Inline::Python
- Perl 6 By Example: Now "Perl 6 Fundamentals"
- Perl 6 Books Landscape in June 2017
- Living on the (b)leading edge
- The Loss of Name and Orientation
- Perl 6 Fundamentals Now Available for Purchase
- My Ten Years of Perl 6
- Perl 6 Coding Contest 2019: Seeking Task Makers
- A shiny perl6.org site
- Creating an entry point for newcomers
- An offer for software developers: free IRC logging
- Sprixel, a 6 compiler powered by JavaScript
- Announcing try.rakudo.org, an interactive Perl 6 shell in your browser
- Another perl6.org iteration
- Blackjack and Perl 6
- Why I commit Crud to the Perl 6 Test Suite
- This Week's Contribution to Perl 6 Week 5: Implement Str.trans
- This Week's Contribution to Perl 6
- This Week's Contribution to Perl 6 Week 8: Implement $*ARGFILES for Rakudo
- This Week's Contribution to Perl 6 Week 6: Improve Book markup
- This Week's Contribution to Perl 6 Week 2: Fix up a test
- This Week's Contribution to Perl 6 Week 9: Implement Hash.pick for Rakudo
- This Week's Contribution to Perl 6 Week 11: Improve an error message for Hyper Operators
- This Week's Contribution to Perl 6 - Lottery Intermission
- This Week's Contribution to Perl 6 Week 3: Write supporting code for the MAIN sub
- This Week's Contribution to Perl 6 Week 1: A website for proto
- This Week's Contribution to Perl 6 Week 4: Implement :samecase for .subst
- This Week's Contribution to Perl 6 Week 10: Implement samespace for Rakudo
- This Week's Contribution to Perl 6 Week 7: Implement try.rakudo.org
- What is the "Cool" class in Perl 6?
- Report from the Perl 6 Hackathon in Copenhagen
- Custom operators in Rakudo
- A Perl 6 Date Module
- Defined Behaviour with Undefined Values
- Dissecting the "Starry obfu"
- The case for distributed version control systems
- Perl 6: Failing Softly with Unthrown Exceptions
- Perl 6 Compiler Feature Matrix
- The first Perl 6 module on CPAN
- A Foray into Perl 5 land
- Gabor: Keep going
- First Grant Report: Structured Error Messages
- Second Grant Report: Structured Error Messages
- Third Grant Report: Structured Error Messages
- Fourth Grant Report: Structured Error Messages
- Google Summer of Code Mentor Recap
- How core is core?
- How fast is Rakudo's "nom" branch?
- Building a Huffman Tree With Rakudo
- Immutable Sigils and Context
- Is Perl 6 really Perl?
- Mini-Challenge: Write Your Prisoner's Dilemma Strategy
- List.classify
- Longest Palindrome by Regex
- Perl 6: Lost in Wonderland
- Lots of momentum in the Perl 6 community
- Monetize Perl 6?
- Musings on Rakudo's spectest chart
- My first executable from Perl 6
- My first YAPC - YAPC::EU 2010 in Pisa
- Trying to implement new operators - failed
- Programming Languages Are Not Zero Sum
- Perl 6 notes from February 2011
- Notes from the YAPC::EU 2010 Rakudo hackathon
- Let's build an object
- Perl 6 is optimized for fun
- How to get a parse tree for a Perl 6 Program
- Pascal's Triangle in Perl 6
- Perl 6 in 2009
- Perl 6 in 2010
- Perl 6 in 2011 - A Retrospection
- Perl 6 ticket life cycle
- The Perl Survey and Perl 6
- The Perl 6 Advent Calendar
- Perl 6 Questions on Perlmonks
- Physical modeling with Math::Model and Perl 6
- How to Plot a Segment of a Circle with SVG
- Results from the Prisoner's Dilemma Challenge
- Protected Attributes Make No Sense
- Publicity for Perl 6
- PVC - Perl 6 Vocabulary Coach
- Fixing Rakudo Memory Leaks
- Rakudo architectural overview
- Rakudo Rocks
- Rakudo "star" announced
- My personal "I want a PONIE" wish list for Rakudo Star
- Rakudo's rough edges
- Rats and other pets
- The Real World Strikes Back - or why you shouldn't forbid stuff just because you think it's wrong
- Releasing Rakudo made easy
- Set Phasers to Stun!
- Starry Perl 6 obfu
- Recent Perl 6 Developments August 2008
- The State of Regex Modifiers in Rakudo
- Strings and Buffers
- Subroutines vs. Methods - Differences and Commonalities
- A SVG plotting adventure
- A Syntax Highlighter for Perl 6
- Test Suite Reorganization: How to move tests
- The Happiness of Design Convergence
- Thoughts on masak's Perl 6 Coding Contest
- The Three-Fold Function of the Smart Match Operator
- Perl 6 Tidings from September and October 2008
- Perl 6 Tidings for November 2008
- Perl 6 Tidings from December 2008
- Perl 6 Tidings from January 2009
- Perl 6 Tidings from February 2009
- Perl 6 Tidings from March 2009
- Perl 6 Tidings from April 2009
- Perl 6 Tidings from May 2009
- Perl 6 Tidings from May 2009 (second iteration)
- Perl 6 Tidings from June 2009
- Perl 6 Tidings from August 2009
- Perl 6 Tidings from October 2009
- Timeline for a syntax change in Perl 6
- Visualizing match trees
- Want to write shiny SVG graphics with Perl 6? Port Scruffy!
- We write a Perl 6 book for you
- When we reach 100% we did something wrong
- Where Rakudo Lives Now
- Why Rakudo needs NQP
- Why was the Perl 6 Advent Calendar such a Success?
- What you can write in Perl 6 today
- Why you don't need the Y combinator in Perl 6
- You are good enough!
Sun, 19 Mar 2017
Perl 6 By Example: Plotting using Matplotlib and Inline::Python
Permanent link

This blog post is part of my ongoing project to write a book about Perl 6.
If you're interested, either in this book project or any other Perl 6 book news, please sign up for the mailing list at the bottom of the article, or here. It will be low volume (less than an email per month, on average).
Occasionally I come across git repositories, and want to know how active they are, and who the main developers are.
Let's develop a script that plots the commit history, and explore how to use Python modules in Perl 6.
Extracting the Stats
We want to plot the number of commits by author and date.
Git makes it easy for us to get to this information by giving some options
to git log:
my $proc = run :out, <git log --date=short --pretty=format:%ad!%an>;
my (%total, %by-author, %dates);
for $proc.out.lines -> $line {
    my ( $date, $author ) = $line.split: '!', 2;
    %total{$author}++;
    %by-author{$author}{$date}++;
    %dates{$date}++;
}
run executes an external command, and :out tells it to capture the
command's output, and makes it available as $proc.out. The command is
a list, with the first element being the actual executable, and the rest of
the elements are command line arguments to this executable.
Here git log gets the options --date short --pretty=format:%ad!%an, which
instructs it to print produce lines like 2017-03-01!John Doe. This line
can be parsed with a simple call to $line.split: '!', 2, which splits
on the !, and limits the result to two elements. Assigning it to a
two-element list ( $date, $author ) unpacks it. We then use hashes to
count commits by author (in %total), by author and date (%by-author)
and finally by date. In the second case, %by-author{$author} isn't
even a hash yet, and we can still hash-index it. This is due to a feature
called autovivification, which automatically creates ("vivifies") objects
where we need them. The use of ++ creates integers, {...} indexing creates
hashes, [...] indexing and .push creates arrays, and so on.
To get from these hashes to the top contributors by commit count, we can
sort %total by value. Since this sorts in ascending order, sorting
by the negative value gives the list in descending order. The list contains
Pair objects, and we only want the
first five of these, and only their keys:
my @top-authors = %total.sort(-*.value).head(5).map(*.key);
For each author, we can extract the dates of their activity and their commit counts like this:
my @dates  = %by-author{$author}.keys.sort;
my @counts = %by-author{$author}{@dates};
The last line uses slicing, that is, indexing an array with list to return a list elements.
Plotting with Python
Matplotlib is a very versatile library for all sorts of plotting and visualization. It's written in Python and for Python programs, but that won't stop us from using it in a Perl 6 program.
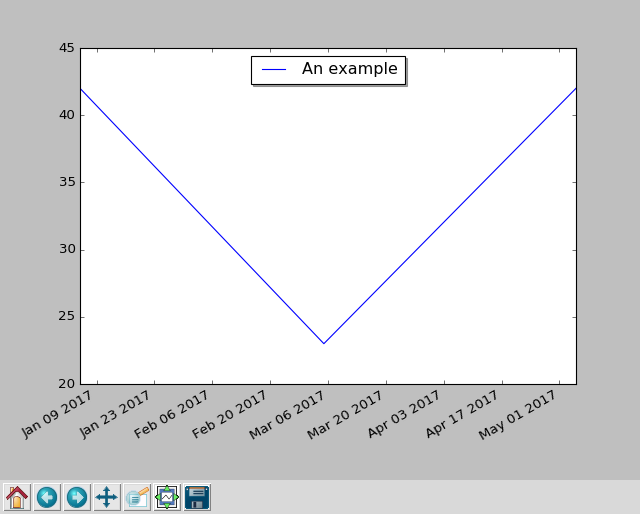
But first, let's take a look at a basic plotting example that uses dates
on the x axis:
import datetime
import matplotlib.pyplot as plt

fig, subplots = plt.subplots()
subplots.plot(
    [datetime.date(2017, 1, 5), datetime.date(2017, 3, 5), datetime.date(2017, 5, 5)],
    [ 42, 23, 42 ],
    label='An example',
)
subplots.legend(loc='upper center', shadow=True)
fig.autofmt_xdate()
plt.show()
To make this run, you have to install python 2.7 and matplotlib. You can do
this on Debian-based Linux systems with apt-get install -y python-matplotlib.
The package name is the same on RPM-based distributions such as CentOS or SUSE
Linux. MacOS users are advised to install a python 2.7 through homebrew and
macports, and then use pip2 install matplotlib or pip2.7 install
matplotlib to get the library. Windows installation is probably easiest
through the conda package manager, which offers
pre-built binaries of both python and matplotlib.
When you run this scripts with python2.7 dates.py, it opens a GUI window, showing
the plot and some controls, which allow you to zoom, scroll, and write the
plot graphic to a file:
Bridging the Gap
The Rakudo Perl 6 compiler comes with a handy library for calling foreign functions, which allows you to call functions written in C, or anything with a compatible binary interface.
The Inline::Python library uses the native call functionality to talk to python's C API, and offers interoperability between Perl 6 and Python code. At the time of writing, this interoperability is still fragile in places, but can be worth using for some of the great libraries that Python has to offer.
To install Inline::Python, you must have a C compiler available, and then
run
$ zef install Inline::Python
(or the same with panda instead of zef, if that's your module installer).
Now you can start to run Python 2 code in your Perl 6 programs:
use Inline::Python;

my $py = Inline::Python.new;
$py.run: 'print("Hello, Pyerl 6")';
Besides the run method, which takes a string of Python code and execute it,
you can also use call to call Python routines by specifying the namespace,
the routine to call, and a list of arguments:
use Inline::Python;

my $py = Inline::Python.new;
$py.run('import datetime');
my $date = $py.call('datetime', 'date', 2017, 1, 31);
$py.call('__builtin__', 'print', $date);    # 2017-01-31
The arguments that you pass to call are Perl 6 objects, like three Int
objects in this example. Inline::Python automatically translates them to
the corresponding Python built-in data structure. It translate numbers,
strings, arrays and hashes. Return values are also translated in opposite
direction, though since Python 2 does not distinguish properly between
byte and Unicode strings, Python strings end up as buffers in Perl 6.
Object that Inline::Python cannot translate are handled as opaque objects
on the Perl 6 side. You can pass them back into python routines (as shown
with the print call above), or you can also call methods on them:
say $date.isoformat().decode; # 2017-01-31
Perl 6 exposes attributes through methods, so Perl 6 has no syntax for
accessing attributes from foreign objects directly. If you try to access
for example the year attribute of datetime.date through the normal method call syntax, you get an error.
say $date.year;
Dies with
'int' object is not callable
Instead, you have to use the getattr builtin:
say $py.call('__builtin__', 'getattr', $date, 'year');
Using the Bridge to Plot
We need access to two namespaces in python, datetime and matplotlib.pyplot,
so let's start by importing them, and write some short helpers:
my $py = Inline::Python.new;
$py.run('import datetime');
$py.run('import matplotlib.pyplot');
sub plot(Str $name, |c) {
    $py.call('matplotlib.pyplot', $name, |c);
}

sub pydate(Str $d) {
    $py.call('datetime', 'date', $d.split('-').map(*.Int));
}
We can now call pydate('2017-03-01') to create a python datetime.date
object from an ISO-formatted string, and call the plot function to access
functionality from matplotlib:
my ($figure, $subplots) = plot('subplots');
$figure.autofmt_xdate();

my @dates = %dates.keys.sort;
$subplots.plot:
    $[@dates.map(&pydate)],
    $[ %dates{@dates} ],
    label     => 'Total',
    marker    => '.',
    linestyle => '';
The Perl 6 call plot('subplots') corresponds to the python code
fig, subplots = plt.subplots(). Passing arrays to python function needs
a bit extra work, because Inline::Python flattens arrays. Using an extra $
sigil in front of an array puts it into an extra scalar, and thus prevents
the flattening.
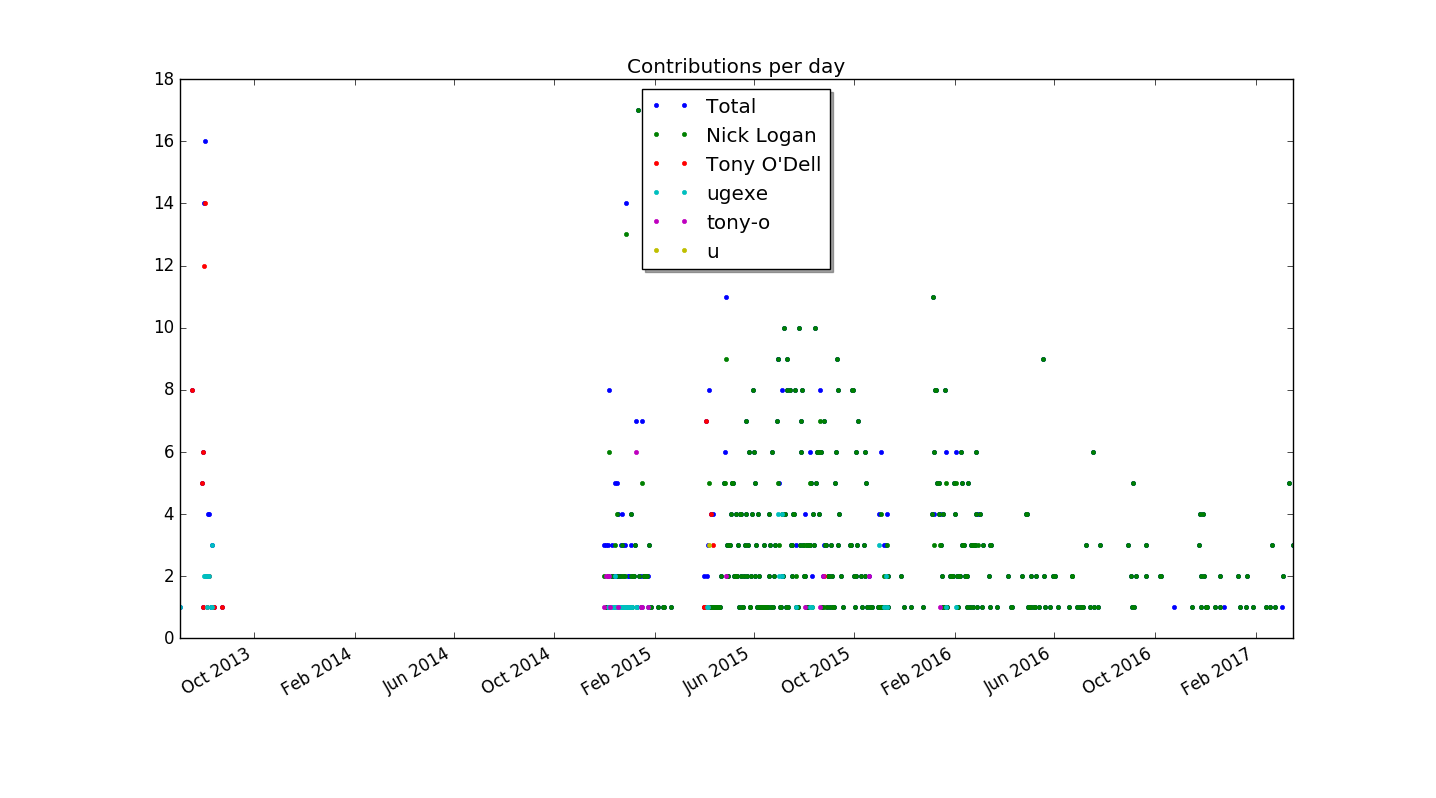
Now we can actually plot the number of commits by author, add a legend, and plot the result:
for @top-authors -> $author {
    my @dates = %by-author{$author}.keys.sort;
    my @counts = %by-author{$author}{@dates};
    $subplots.plot:
        $[ @dates.map(&pydate) ],
        $@counts,
        label     => $author,
        marker    =>'.',
        linestyle => '';
}


$subplots.legend(loc=>'upper center', shadow=>True);

plot('title', 'Contributions per day');
plot('show');
When run in the zef git repository, it produces this plot:
Summary
We've explored how to use the python library matplotlib to generate a plot
from git contribution statistics. Inline::Python provides convenient
functionality for accessing python libraries from Perl 6 code.
In the next installment, we'll explore ways to improve both the graphics and the glue code between Python and Perl 6.